
Microwave Applications Laboratory
Mission
The laboratory concentrates its effort in microwave sensing of environmental variables such as soil moisture, vegetation biomass, sea surface salinity and ice. Many of the applications involve modeling of the vegetation that obscures satellites from sensing the soil below it. Another area of interest is the modeling of communication channels. Propagation statistics in urban and suburban environments is of interest for wireless applications. Calculation of attenuation and scattering by trees is becoming increasingly important as user frequencies rise.
Most of the areas referred to utilize random media theory. Here, propagation and scattering of waves from discrete or continuous random media and from random surfaces have a rich tool box of methods to use for the calculation of quantities such as radar backscattering, brightness temperatures and attenuation from and through complex media.
Presently the laboratory has four areas of immediate interest. They are: measurement of the dielectric constant at microwave frequencies, passive P and L band measurement of root zone soil moisture, channel modeling of trees in urban and mountain environments and remote sensing for water on Mars.
The director of the Laboratory is Professor Roger Lang. He directs four doctoral students—Can Suer, Reid McCargar, Jiaxing Yang, and Ed Michaelchuck—and one visiting scholar, Ming Li. Dr. Saul Torrico, is an adjunct ECE faculty who participates in the laboratories channel modeling activities.
Accurate L Band Seawater Dielectric Constant Measurements

The Microwave Applications Laboratory has made extensive dielectric measurements of seawater at 1.413 GHz to aid NASA in its aim of measuring global open ocean salinities. About 9 years ago Aquarius (NASA) and SMOS (ESA) satellites were put into orbit to make these salinity measurements. With the demise of Aquarius, NASA’s new Soil Moisture Active Passive (SMAP) satellite had taken over Aquarius's measurement activities.
These satellites use radiometers with very sensitive receivers to measure the microwave thermal emission from the ocean's surface. Since the signal is so weak, the receivers operate in the protected band from 1400 to 1427 MHz. The signal is integrated over this band to give an estimate of the noise power emitted from the ocean surface. This power is proportional to the strength of the dielectric constant,  of the seawater. Here S is the salinity and T is the temperature. Since the dielectric constant is related to the salinity, the measured energy (Brightness Temperature, Tb) at the satellite is directly related to the salinity. This measurement process must be very accurate since the sea surface salinity varies only from 34 to 36 psu (physical salinity units) over much of the open ocean. Because of the accuracy required and because of the low signal level, many interfering factors must be taken into account. Some of these are: atmospheric attenuation, sea surface roughness and galactic radiation as illustrated in the figure above.
To make this measurement with the required precision, the relationship between the dielectric constant and the salinity/temperature must be known very accurately. This relationship is known as the model function.
GW Seawater Measurement Setup

A microwave cavity was designed with a resonance at the center of the protected frequency band (1.413 GHz). The seawater is introduced into the cavity via a capillary tube with a very small inner diameter. The cavity shown above was immersed in a coolant composed of distilled water and ethylene glycol whose temperature was kept constant by a circulator to better than .01° C. Seawater whose salinity had been measured to five places of accuracy was purchased from Ocean Scientific International in Havant Hampshire, England.
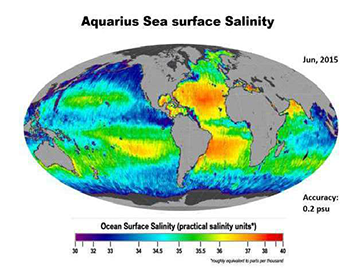
The data from these measurements are used to generate a model function which gives the seawater dielectric constant as a function of salinity and temperature. This function is used in the inversion process of obtaining salinity from the radiometer's brightness temperature. An image of the global salinity generated with data from Aquarius is shown to the right. New values are reported every 7 days.
Soil Moisture Measurements and Modeling

ComRad is a ground based combined radar and radiometer used to measure soil moisture under vegetation at microwave frequencies. The system has been developed jointly by the NASA Goddard Hydrological Science Branch and the Microwave Applications Laboratory at the George Washington University. Its radar operates at 1.25 GHz (L band), 5.0 GHz (C band) and 10.0 GHz (X Band). The Land C band radars have HH, VY and HY polarizations while the X band radar is vertically polarized. There are horizontal and vertical polarized total power radiometers at 1.4 GHz. The radiometers are thermally regulated to about 1°c.
Most recently ComRad’s L band radar and radiometers have been used as a ground based simulator for the SMAP satellite. Although ComRad has traveled to sites throughout the US, it has remained in the Washington DC area most recently. Experiments involving NASA Goddard, the USDA (US Department of Agriculture) and GW have taken place in the Beltsville, MD area on USDA farm sites. Fields of wheat, corn and soy beans have been planted by the USDA in fully instrumented fields, i.e., soil moisture measurements and temperature at various depths and field locations. Measurements of trees have been made with ground truth collected by GW students.
Radar and radiometers measurements have been made by sweeping the boom over a 120 degree arc while continuously taking measured data. The system has been automated so that it wakes up at selected times, makes a sweep and then goes back to sleep. This allows for unsupervised measurements anytime during the day or night. Typically soil moisture measurements are made during a dry-down. After a heavy rain the soil dries down over a period of days so that measurement data is obtained for many different soil conditions.
To relate radar/radiometer measurement data to soil moisture conditions, GW has developed electromagnetic models for the vegetation and for the soil. The soil is then modeled by a dielectric media whose dielectric constant is related to the soil’s moisture. The vegetation is modeled as a discrete random media whose particles are the components of the vegetation. These components—stems, leaves, branches, etc.—are represented by dielectric cylinders and discs , with prescribed orientation statistics. Using stochastic techniques, an equivalent dielectric medium is found for the vegetation and the scatterers are embedded in the equivalent dielectric medium. Calculation of attenuation, backscatter and brightness temperature are then made using these models. A connection between brightness temperature and the backscattering cross section can then be made to the soil moisture for inversion purposes.
Bistatic Scattering from Tree Covered Mountainsides

Mountainous terrain presents a significant challenge for ground to ground radio frequency (RF) communications, especially when non-line-of-sight propagation paths (NLOS) exists between the transmitter and receiver. The reflection of radio waves from forest covered mountainsides has proven to be a critical path for radio wave propagation in these areas, yet little is known about the electromagnetic properties and the effective roughness of the reflecting surfaces. To better understand the scattering mechanisms the GW Forest Model is being generalized to include forests on inclined surfaces.
To validate the modeling approach, field experiments were implemented. Personnel from the Cold Regions Research and Electronics Laboratories (CRREL) at Hanover, NH agreed to help make the measurements. They had considerable experience in making NLOS UHF propagation measurements in the White Mountains of New Hampshire. It was planned to make a series of P band (437 MHz) and L band (1270 MHz) measurements at selected sites in the White Mountains. The GW team traveled to the White Mountains to obtain ground truth data in the illuminated forest areas. Statistics for the forest model such as the distribution of tree diameter at breast height (DBH) were measured; tree type and average height were obtained along with ground roughness and moisture. This data is being used in the GW forest models. The plan is to compare field measurements with model results.
Radar Backscatter from Martian Regolith: Buried Ice Detection

The purpose of this study is to assess the possibility of using P and L band Synthetic Aperture Radar (SAR) aboard a low orbiting satellite to detect buried water /ice at depths of up to 10 meters under the Martian regolith. The scattering model consists of a homogeneous free space region over a layer of regolith like material. It is assumed that this regolith layer is over a water/ice half space. Both interfaces are assumed to be rough. In addition, small basalt particles are dispersed throughout the regolith layer . The results of the study show that if the upper surface is assumed sufficiently smooth, the ice can be detected at depths up to 4 meters at L band and up to 8 meters at P band. Particle scattering density can interfere with these estimates if the backscattering from particles is too great. A model is shown to the right.